
Query and analyze spatial data
After having created a SpatialData collection, we briefly discuss how to query and analyze spatial data.
import lamindb as ln
import bionty as bt
import squidpy as sq
import scanpy as sc
import spatialdata_plot
import warnings

warnings.filterwarnings("ignore")

ln.track(project="spatial guide datasets")
Show code cell output
→ connected lamindb: testuser1/test-spatial
/opt/hostedtoolcache/Python/3.12.10/x64/lib/python3.12/site-packages/xarray_schema/__init__.py:1: UserWarning: pkg_resources is deprecated as an API. See https://setuptools.pypa.io/en/latest/pkg_resources.html. The pkg_resources package is slated for removal as early as 2025-11-30. Refrain from using this package or pin to Setuptools<81.
  from pkg_resources import DistributionNotFound, get_distribution
/opt/hostedtoolcache/Python/3.12.10/x64/lib/python3.12/site-packages/leidenalg/VertexPartition.py:413: SyntaxWarning: invalid escape sequence '\m'
  .. math:: Q = \\frac{1}{m} \\sum_{ij} \\left(A_{ij} - \\frac{k_i^\mathrm{out} k_j^\mathrm{in}}{m} \\right)\\delta(\\sigma_i, \\sigma_j),
/opt/hostedtoolcache/Python/3.12.10/x64/lib/python3.12/site-packages/leidenalg/VertexPartition.py:788: SyntaxWarning: invalid escape sequence '\m'
  .. math:: Q = \\sum_{ij} \\left(A_{ij} - \\gamma \\frac{k_i^\mathrm{out} k_j^\mathrm{in}}{m} \\right)\\delta(\\sigma_i, \\sigma_j),
/opt/hostedtoolcache/Python/3.12.10/x64/lib/python3.12/site-packages/leidenalg/Optimiser.py:27: SyntaxWarning: invalid escape sequence '\g'
  implementation therefore does not guarantee subpartition :math:`\gamma`-density.
/opt/hostedtoolcache/Python/3.12.10/x64/lib/python3.12/site-packages/leidenalg/Optimiser.py:346: SyntaxWarning: invalid escape sequence '\s'
  .. math:: Q = \sum_k \\lambda_k Q_k.
/opt/hostedtoolcache/Python/3.12.10/x64/lib/python3.12/site-packages/anndata/utils.py:434: FutureWarning: Importing read_text from `anndata` is deprecated. Import anndata.io.read_text instead.
  warnings.warn(msg, FutureWarning)
→ created Transform('8tC7je6k4yfL0000'), started new Run('UkKBemPM...') at 2025-06-03 16:32:34 UTC
→ notebook imports: bionty==1.5.0 lamindb==1.6.1 scanpy==1.11.2 spatialdata-plot==0.2.10 squidpy==1.6.5
• recommendation: to identify the notebook across renames, pass the uid: ln.track("8tC7je6k4yfL", project="spatial guide datasets")
Query by data lineage
Query the transform, e.g., by key:
transform = ln.Transform.get(key="spatial.ipynb")
transform
Show code cell output
Transform(uid='0O4KqHkBFmvj0000', is_latest=True, key='spatial.ipynb', description='Spatial', type='notebook', hash='N3vcb3sKkBt5OO396bEd9Q', branch_id=1, space_id=1, created_by_id=1, created_at=2025-06-03 16:30:51 UTC)
Query the artifacts:
ln.Artifact.filter(transform=transform).df()
Show code cell output
| uid | key | description | suffix | kind | otype | size | hash | n_files | n_observations | _hash_type | _key_is_virtual | _overwrite_versions | space_id | storage_id | schema_id | version | is_latest | run_id | created_at | created_by_id | _aux | branch_id | |
|---|---|---|---|---|---|---|---|---|---|---|---|---|---|---|---|---|---|---|---|---|---|---|---|
| id | |||||||||||||||||||||||
| 1 | VJJfeK3PfFjHyITh0000 | example_blobs.zarr | None | .zarr | dataset | SpatialData | 12121751 | PVAyIfD1N-Fgcg1Z3RW0Vg | 113 | None | md5-d | True | True | 1 | 1 | NaN | None | True | 1 | 2025-06-03 16:30:53.490000+00:00 | 1 | None | 1 |
| 3 | qWQkl6HRBu4YtJvt0000 | xenium1.zarr | None | .zarr | dataset | SpatialData | 35115549 | Ql-ypFaer0qbdOS2noc4Eg | 145 | None | md5-d | True | True | 1 | 1 | 3.0 | None | True | 1 | 2025-06-03 16:31:25.718000+00:00 | 1 | None | 1 |
| 5 | 0iTOz0DdAPF59vsH0000 | xenium2.zarr | None | .zarr | dataset | SpatialData | 40822700 | IrzsKhNiz3BqaioXQ8uvRg | 174 | None | md5-d | True | True | 1 | 1 | 3.0 | None | True | 1 | 2025-06-03 16:31:46.916000+00:00 | 1 | None | 1 |
| 7 | lCqvtnqwLAK2EEHG0000 | visium.zarr | None | .zarr | dataset | SpatialData | 5809805 | FZeDx1wqVqFxiS_c07VO8g | 133 | None | md5-d | True | True | 1 | 1 | 3.0 | None | True | 1 | 2025-06-03 16:32:12.747000+00:00 | 1 | None | 1 |
Query by biological metadata
Query all visium datasets.
all_xenium_data = ln.Artifact.filter(experimental_factors__name="10x Xenium")
all_xenium_data.df()
Show code cell output
| uid | key | description | suffix | kind | otype | size | hash | n_files | n_observations | _hash_type | _key_is_virtual | _overwrite_versions | space_id | storage_id | schema_id | version | is_latest | run_id | created_at | created_by_id | _aux | branch_id | |
|---|---|---|---|---|---|---|---|---|---|---|---|---|---|---|---|---|---|---|---|---|---|---|---|
| id | |||||||||||||||||||||||
| 3 | qWQkl6HRBu4YtJvt0000 | xenium1.zarr | None | .zarr | dataset | SpatialData | 35115549 | Ql-ypFaer0qbdOS2noc4Eg | 145 | None | md5-d | True | True | 1 | 1 | 3 | None | True | 1 | 2025-06-03 16:31:25.718000+00:00 | 1 | None | 1 |
| 5 | 0iTOz0DdAPF59vsH0000 | xenium2.zarr | None | .zarr | dataset | SpatialData | 40822700 | IrzsKhNiz3BqaioXQ8uvRg | 174 | None | md5-d | True | True | 1 | 1 | 3 | None | True | 1 | 2025-06-03 16:31:46.916000+00:00 | 1 | None | 1 |
Query all artifacts that measured the “celltype_major” feature:
# Only returns the Xenium datasets as the Visium dataset did not have annotated cell types
feature_cell_type_major = ln.Feature.get(name="celltype_major")
query_set = ln.Artifact.filter(feature_sets__features=feature_cell_type_major).all()
xenium_1_af, xenium_2_af = query_set[0], query_set[1]
xenium_1_af.describe()
Show code cell output
Artifact .zarr/SpatialData
├── General
│   ├── .uid = 'qWQkl6HRBu4YtJvt0000'
│   ├── .key = 'xenium1.zarr'
│   ├── .size = 35115549
│   ├── .hash = 'Ql-ypFaer0qbdOS2noc4Eg'
│   ├── .n_files = 145
│   ├── .path = /home/runner/work/lamin-usecases/lamin-usecases/docs/test-spatial/.lamindb/qWQkl6HRBu4YtJvt.zarr
│   ├── .created_by = testuser1 (Test User1)
│   ├── .created_at = 2025-06-03 16:31:25
│   └── .transform = 'Spatial'
├── Dataset features
│   ├── attrs:sample • 4            [Feature]
│   │   assay                       cat[bionty.ExperimentalF…  10x Xenium
│   │   disease                     cat[bionty.Disease]        ductal breast carcinoma in situ
│   │   organism                    cat[bionty.Organism]       human
│   │   tissue                      cat[bionty.Tissue]         breast
│   ├── tables:table:obs • 1        [Feature]
│   │   celltype_major              cat[bionty.CellType]       B cell, T cell, cancer associated fibrob…
│   └── tables:table:var.T • 313    [bionty.Gene.ensembl_gen…
│       ABCC11                      num
│       ACTA2                       num
│       ACTG2                       num
│       ADAM9                       num
│       ADGRE5                      num
│       ADH1B                       num
│       ADIPOQ                      num
│       AGR3                        num
│       AHSP                        num
│       AIF1                        num
│       AKR1C1                      num
│       AKR1C3                      num
│       ALDH1A3                     num
│       ANGPT2                      num
│       ANKRD28                     num
│       ANKRD29                     num
│       ANKRD30A                    num
│       APOBEC3A                    num
│       APOBEC3B                    num
│       APOC1                       num
└── Labels
    └── .projects                   Project                    spatial guide datasets
        .organisms                  bionty.Organism            human
        .tissues                    bionty.Tissue              breast
        .cell_types                 bionty.CellType            endothelial cell, myeloid cell, perivasc…
        .diseases                   bionty.Disease             ductal breast carcinoma in situ
        .experimental_factors       bionty.ExperimentalFactor  10x Xenium
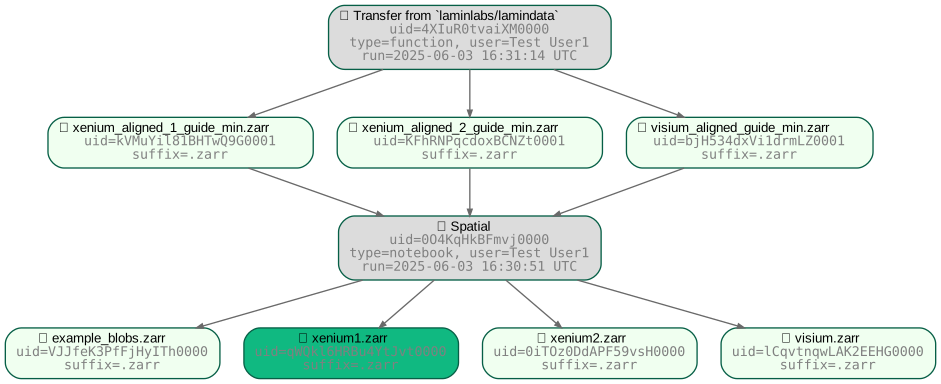
xenium_1_af.view_lineage()
Show code cell output
xenium_2_af.describe()
Show code cell output
Artifact .zarr/SpatialData
├── General
│   ├── .uid = '0iTOz0DdAPF59vsH0000'
│   ├── .key = 'xenium2.zarr'
│   ├── .size = 40822700
│   ├── .hash = 'IrzsKhNiz3BqaioXQ8uvRg'
│   ├── .n_files = 174
│   ├── .path = /home/runner/work/lamin-usecases/lamin-usecases/docs/test-spatial/.lamindb/0iTOz0DdAPF59vsH.zarr
│   ├── .created_by = testuser1 (Test User1)
│   ├── .created_at = 2025-06-03 16:31:46
│   └── .transform = 'Spatial'
├── Dataset features
│   ├── attrs:sample • 4            [Feature]
│   │   assay                       cat[bionty.ExperimentalF…  10x Xenium
│   │   disease                     cat[bionty.Disease]        ductal breast carcinoma in situ
│   │   organism                    cat[bionty.Organism]       human
│   │   tissue                      cat[bionty.Tissue]         breast
│   ├── tables:table:obs • 1        [Feature]
│   │   celltype_major              cat[bionty.CellType]       B cell, T cell, cancer associated fibrob…
│   └── tables:table:var.T • 313    [bionty.Gene.ensembl_gen…
│       ABCC11                      num
│       ACTA2                       num
│       ACTG2                       num
│       ADAM9                       num
│       ADGRE5                      num
│       ADH1B                       num
│       ADIPOQ                      num
│       AGR3                        num
│       AHSP                        num
│       AIF1                        num
│       AKR1C1                      num
│       AKR1C3                      num
│       ALDH1A3                     num
│       ANGPT2                      num
│       ANKRD28                     num
│       ANKRD29                     num
│       ANKRD30A                    num
│       APOBEC3A                    num
│       APOBEC3B                    num
│       APOC1                       num
└── Labels
    └── .projects                   Project                    spatial guide datasets
        .organisms                  bionty.Organism            human
        .tissues                    bionty.Tissue              breast
        .cell_types                 bionty.CellType            endothelial cell, myeloid cell, perivasc…
        .diseases                   bionty.Disease             ductal breast carcinoma in situ
        .experimental_factors       bionty.ExperimentalFactor  10x Xenium
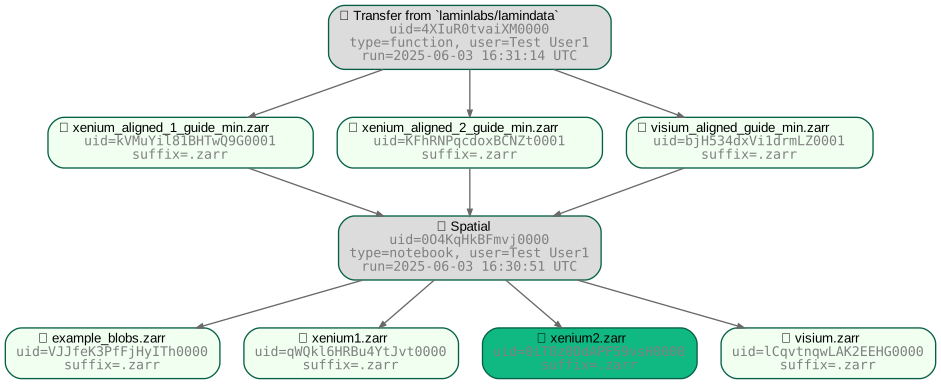
xenium_2_af.view_lineage()
Show code cell output
Analyze spatial data
Spatial data datasets stored as SpatialData objects can easily be examined and analyzed through the SpatialData framework, squidpy, and scanpy:
xenium_1_sd = xenium_1_af.load()
xenium_1_sd
Show code cell output
version mismatch: detected: RasterFormatV02, requested: FormatV04
version mismatch: detected: RasterFormatV02, requested: FormatV04
SpatialData object, with associated Zarr store: /home/runner/work/lamin-usecases/lamin-usecases/docs/test-spatial/.lamindb/qWQkl6HRBu4YtJvt.zarr
├── Images
│     ├── 'morphology_focus': DataTree[cyx] (1, 2310, 3027), (1, 1155, 1514), (1, 578, 757), (1, 288, 379), (1, 145, 189)
│     └── 'morphology_mip': DataTree[cyx] (1, 2310, 3027), (1, 1155, 1514), (1, 578, 757), (1, 288, 379), (1, 145, 189)
├── Points
│     └── 'transcripts': DataFrame with shape: (<Delayed>, 8) (3D points)
├── Shapes
│     ├── 'cell_boundaries': GeoDataFrame shape: (1899, 1) (2D shapes)
│     └── 'cell_circles': GeoDataFrame shape: (1812, 2) (2D shapes)
└── Tables
      └── 'table': AnnData (1812, 313)
with coordinate systems:
    ▸ 'aligned', with elements:
        morphology_focus (Images), morphology_mip (Images), transcripts (Points), cell_boundaries (Shapes), cell_circles (Shapes)
    ▸ 'global', with elements:
        morphology_focus (Images), morphology_mip (Images), transcripts (Points), cell_boundaries (Shapes), cell_circles (Shapes)
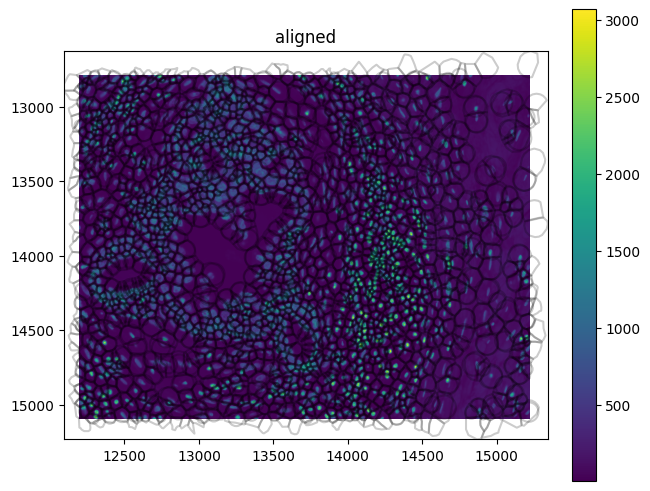
Use spatialdata-plot to get an overview of the dataset:
xenium_1_sd.pl.render_images(element="morphology_focus").pl.render_shapes(
    fill_alpha=0, outline_alpha=0.2
).pl.show(coordinate_systems="aligned")
For any Xenium analysis we would use the AnnData object, which contains the count matrix, cell and gene annotations.
It is stored in the spatialdata.tables slot:
xenium_adata = xenium_1_sd.tables["table"]
xenium_adata
Show code cell output
AnnData object with n_obs × n_vars = 1812 × 313
    obs: 'cell_id', 'transcript_counts', 'control_probe_counts', 'control_codeword_counts', 'total_counts', 'cell_area', 'nucleus_area', 'region', 'dataset', 'celltype_major', 'celltype_minor'
    var: 'symbols', 'feature_types', 'genome'
    uns: 'spatialdata_attrs'
    obsm: 'spatial'
xenium_adata.obs
Show code cell output
| cell_id | transcript_counts | control_probe_counts | control_codeword_counts | total_counts | cell_area | nucleus_area | region | dataset | celltype_major | celltype_minor | |
|---|---|---|---|---|---|---|---|---|---|---|---|
| 92782 | 92783 | 271 | 1 | 0 | 272 | 401.484219 | 27.048594 | cell_circles | xe_rep1 | cancer associated fibroblast | CAFs myCAF-like |
| 92783 | 92784 | 110 | 0 | 0 | 110 | 163.826875 | 21.900781 | cell_circles | xe_rep1 | cancer associated fibroblast | CAFs myCAF-like |
| 92784 | 92785 | 158 | 1 | 0 | 159 | 262.583594 | 7.225000 | cell_circles | xe_rep1 | cancer associated fibroblast | CAFs myCAF-like |
| 92785 | 92786 | 236 | 3 | 0 | 239 | 512.207344 | 17.701250 | cell_circles | xe_rep1 | cancer associated fibroblast | CAFs myCAF-like |
| 92786 | 92787 | 133 | 0 | 0 | 133 | 361.250000 | 20.997656 | cell_circles | xe_rep1 | endothelial cell | Endothelial Lymphatic LYVE1 |
| ... | ... | ... | ... | ... | ... | ... | ... | ... | ... | ... | ... |
| 95912 | 95913 | 138 | 0 | 0 | 138 | 317.358125 | 29.125781 | cell_circles | xe_rep1 | T cell | T cells CD4+ |
| 95913 | 95914 | 148 | 0 | 0 | 148 | 174.393438 | 21.404063 | cell_circles | xe_rep1 | T cell | T cells CD8+ |
| 95914 | 95915 | 152 | 0 | 0 | 152 | 275.724063 | 31.609375 | cell_circles | xe_rep1 | cancer associated fibroblast | CAFs myCAF-like |
| 95915 | 95916 | 125 | 0 | 0 | 125 | 121.921875 | 28.222656 | cell_circles | xe_rep1 | T cell | T cells CD4+ |
| 95916 | 95917 | 135 | 0 | 0 | 135 | 115.374219 | 13.862969 | cell_circles | xe_rep1 | myeloid cell | Macrophage |
1812 rows × 11 columns
Calculate the quality control metrics on the AnnData object using scanpy.pp.calculate_qc_metrics:
sc.pp.calculate_qc_metrics(xenium_adata, percent_top=(10, 20, 50, 150), inplace=True)
The percentage of control probes and control codewords can be calculated from the obs slot:
cprobes = (
    xenium_adata.obs["control_probe_counts"].sum()
    / xenium_adata.obs["total_counts"].sum()
    * 100
)
cwords = (
    xenium_adata.obs["control_codeword_counts"].sum()
    / xenium_adata.obs["total_counts"].sum()
    * 100
)
print(f"Negative DNA probe count % : {cprobes}")
print(f"Negative decoding count % : {cwords}")
Show code cell output
Negative DNA probe count % : 0.07469165751640662
Negative decoding count % : 0.004468731646280738
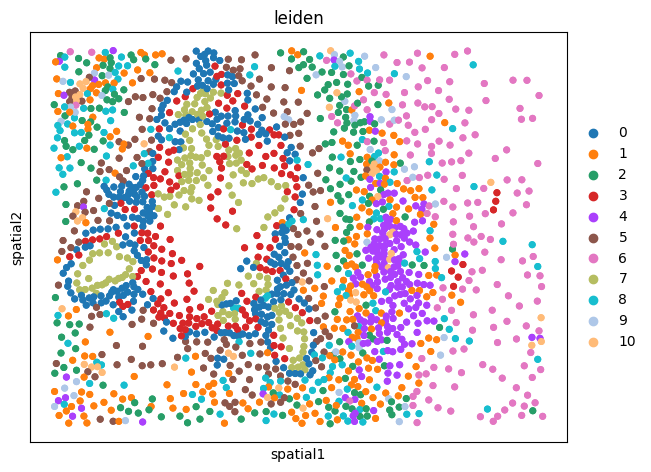
Visualize annotation on UMAP and spatial coordinates:
xenium_adata.layers["counts"] = xenium_adata.X.copy()
sc.pp.normalize_total(xenium_adata, inplace=True)
sc.pp.log1p(xenium_adata)
sc.pp.pca(xenium_adata)
sc.pp.neighbors(xenium_adata)
sc.tl.umap(xenium_adata)
sc.tl.leiden(xenium_adata)
sc.pl.umap(
    xenium_adata,
    color=[
        "total_counts",
        "n_genes_by_counts",
        "leiden",
    ],
    wspace=0.4,
)

sq.pl.spatial_scatter(
    xenium_adata,
    library_id="spatial",
    shape=None,
    color=[
        "leiden",
    ],
    wspace=0.4,
)
For a full tutorial on how to perform analysis of Xenium data, we refer to squidpy’s Xenium tutorial.
ln.finish()
Show code cell output
→ finished Run('UkKBemPM') after 44s at 2025-06-03 16:33:18 UTC